
When people talk about the ROI of psychometric testing, they usually keep the conversation at a high level. You’ll hear about hiring better candidates, reducing turnover, and improving productivity. Those benefits are real, but they don’t help much when you’re sitting in front of a CHRO or CFO who expects a clear business case backed by numbers.
Every organization hires differently, so generic ROI estimates rarely tell the full story. This guide shows you how to build a calculation based on your own hiring volume, salary bands, and turnover rate. It also includes trusted benchmark data, reliable statistics, and explains how Xobin’s assessment platform insights support the overall analysis.
TL;DR – Key Takeaways!
- Most psychometric testing ROI conversations stay conceptual. This guide provides an actual step-by-step model you can run against your own hiring volume, salary bands, and turnover rate.
- The bad hire baseline matters before anything else. Without it, the ROI calculation has no foundation. A widely used conservative estimate puts the floor at 30% of first-year salary.
- Three variables drive the ROI: bad hire rate reduction, voluntary turnover improvement, and time-to-hire savings. Bad hire cost and time-to-hire savings use conservative industry benchmarks; retention improvement uses your own estimate, since published figures on this vary too widely to borrow responsibly.
- The model is illustrative, not a guarantee. Your actual ROI depends on your current rates and how rigorously results are integrated into hiring decisions.
- Psychometric test ROI doesn’t end at the hire. Post-hire use in onboarding, succession planning, and L&D targeting compounds the return over the employee’s tenure.
Why Bad Hire Cost Is the Starting Point for Any ROI Calculation
Before calculating the ROI of psychometric testing, you need an accurate baseline for what poor hiring decisions cost today, without any assessment layer.
A widely used conservative estimate puts the cost of a bad hire at a minimum of 30% of that employee’s first-year salary. A more granular, sourced breakdown comes from the Center for American Progress (Boushey & Glynn, 2012): turnover costs run about 16% of salary for low-wage roles, 20% for mid-range positions, and up to 213% for executive roles. These figures cover the direct costs: the search fee or job board spend, the recruiter and hiring manager time, the onboarding investment, and the separation costs when the hire doesn’t work out.
Worth separating from this: the cost of a bad hire (replacement and productivity loss) is a different metric from cost per hire (the baseline recruiting spend to fill any role, good or bad).
The latest SHRM 2025 Benchmarking Report highlights a steady rise in hiring expenses. On average, filling a non-executive role costs $5,475, while recruiting an executive costs $35,879. These numbers have moved well beyond the previously cited $4,700 average. That’s the floor you’re spending regardless of hire quality; the bad hire cost above is what gets added on top when the hire doesn’t work out.
What they often don’t fully capture are the indirect costs:
- Productivity loss during vacancy. Every week a role sits open is revenue or output the company isn’t generating. Revenue-producing roles make this calculable. Support or operations roles often absorb it invisibly.
- Team disruption. A bad hire who stays six months before leaving takes manager attention, generates interpersonal friction, and often forces colleagues to compensate for underperformance. This cost never shows up on an invoice, but it shows up in engagement scores and peer attrition.
- Rehiring cycle. Why does hiring for the same role again often cost more than the first time? Urgency compresses evaluation quality, which raises the odds of another marginal hire.
Bad Hire Cost by Salary Band
| Role Salary | Conservative Estimate (30%) | CAP Mid-Range (20%) | CAP Executive (213%) |
| $40,000 | $12,000 | $8,000 | $85,200 |
| $60,000 | $18,000 | $12,000 | $127,800 |
| $100,000 | $30,000 | $20,000 | $213,000 |
| $150,000 | $45,000 | $30,000 | $319,500 |
For most organizations, the bad hire cost isn’t the rare catastrophic senior mis-hire. It’s the steady, low-visibility accumulation of mid-level roles filled with candidates who were “close enough”: people who leave within 12 months, need disproportionate management, or simply never reach the performance level the role demands.
For a deeper look at the assessment mistakes that cause these outcomes, see our guide to common psychometric testing mistakes to avoid.
What Does the Research Say About Psychometric Testing ROI?
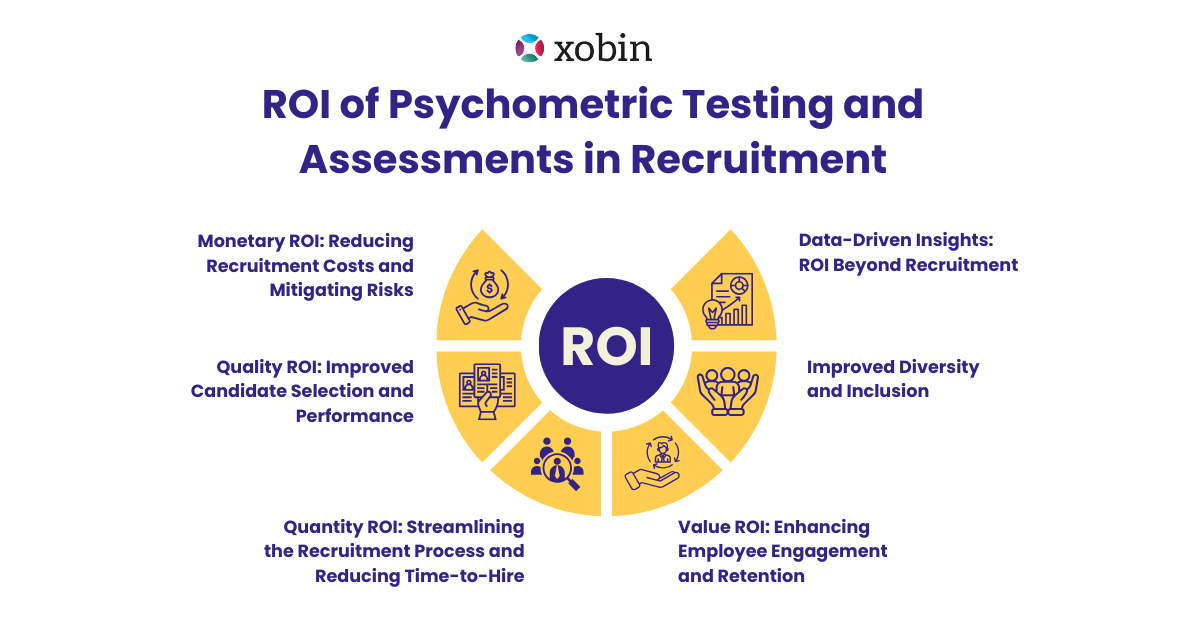
Reducing that exposure is exactly what psychometric testing is designed to do. Independent research beyond Xobin’s own data confirms the effect: voluntary turnover drops, quality of hire improves, and the dollar value of a well-selected hire shifts measurably.
Voluntary turnover reduction: 62% of employers report improvement
TestGorilla’s 2025 State of Skills-Based Hiring Report, surveying over 2,100 employers and job seekers across the UK and US, found that 62% of employers using psychometric tests and pre-employment assessments report improved employee retention as a result. This is a self-reported figure, not an experimental one, but it’s reinforced by academic research: a meta-analysis in Personnel Psychology found that conscientiousness and emotional stability, the exact traits most personality assessments measure, are among the strongest predictors of actual voluntary turnover decisions (Zimmerman, 2008).
Quality of hire improvement: 78% of organizations report it
SHRM’s 2024 Talent Trends Report found that 78% of HR professionals believe pre-employment assessments have improved the quality of their hires. This is a self-reported figure, not an experimental one, but it represents the lived experience of HR practitioners at scale.
Time-to-hire reduction: 70% (Xobin customers)
Xobin customers report an average 70% reduction in time-to-hire. This reflects the front-end efficiency of automated screening: when cognitive assessments filter the applicant pool before any human review, TA teams spend less time on CV screening and early-stage interviews.
Performance value gain: minimum 40% of salary per hire
Using validated selection methods instead of unstructured hiring can shift the dollar value of an employee’s output by a minimum of 40% of their salary, based on Schmidt and Hunter’s foundational utility analysis (Schmidt & Hunter, 1998). For a $60,000 role, that’s a swing of at least $24,000 in performance value between a well-selected and poorly-selected hire. This 40% figure is Schmidt and Hunter’s stated lower bound; their own research found actual values often run higher, up to 70% of salary.
Platform-wide candidate completion: 89.5%
Xobin’s candidate completion rate across its platform sits at 89.5%, relevant for ROI calculations because completion rate directly affects the quality of data available for the hiring decision. A test that 40% of candidates abandon generates a biased sample.
How Do You Calculate the ROI of Psychometric Testing?
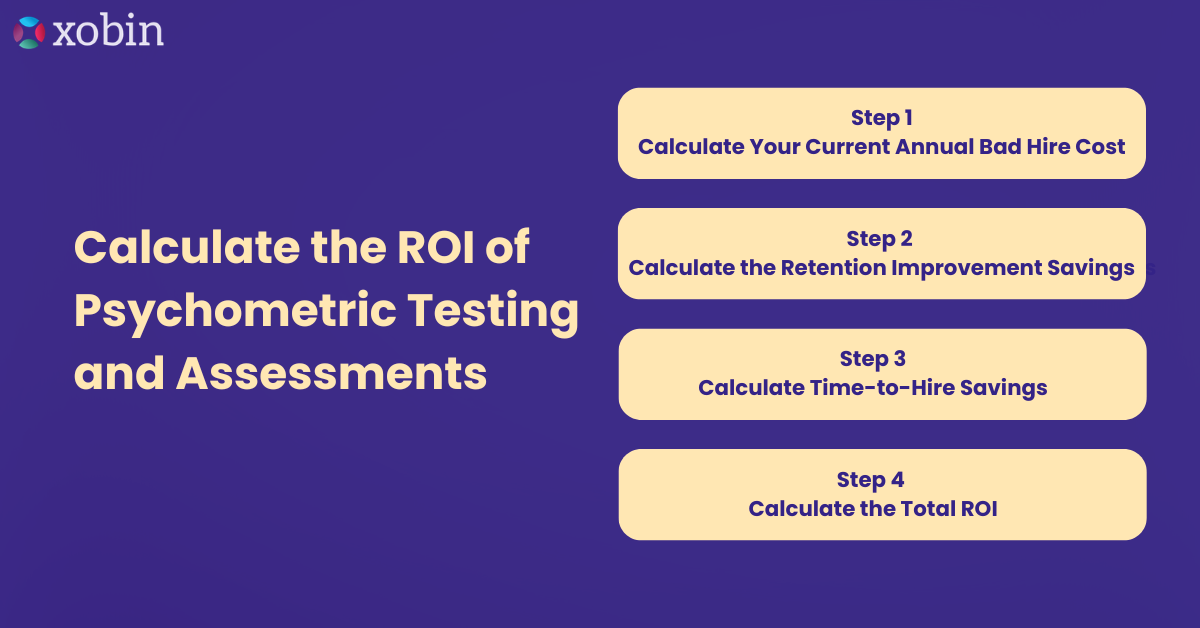
Here is a step-by-step model you can apply to your own hiring data. The inputs are conservative industry benchmarks rather than best-case scenarios.
Step 1: Calculate Your Current Annual Bad Hire Cost
Formula: Number of annual hires × Average first-year salary × Current bad hire rate × Bad hire cost percentage
Industry benchmark: Bad hire rate without structured assessment = 15 to 25% of annual hires. This is a deliberately conservative range; the most-cited large-sample study on hiring failure, Leadership IQ’s tracking of over 20,000 new hires, found 46% of new hires failed within 18 months by a broad definition (would-not-rehire, forced exit, or significant disciplinary action). We use the 15–25% range since it represents the hires that typically require a full replacement, rather than including every hiring decision a manager might later question. Bad hire cost = 30% of first-year salary (a widely used conservative floor).
Example (50 hires/year, $60,000 average salary, 20% bad hire rate):
- 50 hires × 20% = 10 bad hires
- 10 bad hires × $18,000 (30% of $60,000) = $180,000 annual bad hire cost
This baseline feeds into Step 4, where you’ll apply one more input: what percentage of these bad hires do you expect structured assessment to prevent? As with the retention improvement in Step 2, this is not a number worth borrowing from an external source. Vendor case studies claim anywhere from 30% to 65% depending on role type and implementation quality, with wildly inconsistent methodology behind each figure. Use your own conservative estimate based on how rigorously you plan to integrate assessment results into hiring decisions. The worked example in Step 4 uses 50% purely as an illustrative midpoint, not a sourced benchmark.
Step 2: Calculate the Retention Improvement Savings
Formula: Current voluntary turnover rate × Number of employees × Average replacement cost × Your expected retention improvement
Industry benchmark: Average replacement cost = 50% of annual salary, conservative floor. This figure is often labeled a “SHRM estimate,” but SHRM’s own published research attributes it to Gallup, which puts replacement cost at 50% to 200% of annual salary (Gallup, cited in SHRM Labs). For the improvement percentage, use your own estimate rather than a borrowed industry figure; published numbers on this range widely (from roughly 15% to over 60% depending on how the study measured it and how rigorously assessment results get used in hiring decisions), so plugging in a number specific to your hiring process will give you a far more honest result than any single external stat could.
Example (200 employees, 25% voluntary turnover, $60,000 average salary, assuming a conservative 15% improvement):
- 200 × 25% = 50 voluntary departures per year
- 50 × $30,000 (50% of $60,000) = $1,500,000 annual turnover cost
- $1,500,000 × 15% = $225,000 potential annual savings from retention improvement
Step 3: Calculate Time-to-Hire Savings
Formula: Average time-to-hire (days) × Recruiter day rate × Number of annual hires × 70% (Xobin time-to-hire reduction)
Let’s use a simple scenario. Your team fills roles in an average of 30 days, each recruiter costs $400 per day, and you’re recruiting 50 new employees.
- Every hire takes about 30 days, and at $400 per recruiter day, that’s $12,000 spent on recruiter time for a single position (30 days × $400 = $12,000 ).
- Scale that across 50 hires, and your recruitment cost reaches $600,000 (50 hires × $12,000).
- Cut your hiring timeline by 70%, and you could potentially save $420,000 in recruiter time alone ($600,000 × 70%).
Not all of this is pure savings, since some recruiter time shifts to other tasks rather than disappearing entirely. A conservative figure assumes 30% of this becomes genuine capacity savings: $126,000.
Step 4: Calculate the Total ROI
Total annual benefits (conservative):
| Benefit | Calculation | Amount |
| Bad hire reduction | $180,000 × 50% (illustrative; use your own estimate) | $90,000 |
| Retention improvement | From Step 2, using your own conservative estimate | $225,000 |
| Time-to-hire capacity savings | — | $126,000 |
| Total | $441,000 |
Estimated annual platform cost (Xobin, 50 hires/year): $20,000 to $40,000 depending on configuration. Using the midpoint of $30,000:
ROI = (441,000 − 30,000) / 30,000 × 100 = 1,370%
Even at the top of that cost range ($40,000), the ROI still comes out to:
ROI = (441,000 − 40,000) / 40,000 × 100 = 1,003%
This is a model-based estimate using conservative industry benchmarks, not a measured outcome from a specific organization. Your actual ROI will vary based on your current bad hire rate, voluntary turnover rate, average salary, and how rigorously assessment results get integrated into hiring decisions. The model is designed to show the structure of the calculation, not to promise a specific return.
If you’re still weighing whether the investment makes sense for your organization, our breakdown of whether psychometric testing is worth it for recruitment walks through the decision beyond the numbers.
Even at the conservative end of these estimates and with a generous platform cost figure, the ROI exceeds 10:1. Why does math hold up this well? Psychometric testing reduces costs that compound: each bad hire avoided, each voluntary departure prevented, and each day removed from the hiring cycle produces savings that accumulate across every subsequent hiring cycle.
For a step-by-step guide on setting up the workflow that delivers these savings, see our guide on how to integrate psychometric tests in your hiring process.
How Does Xobin Deliver on These ROI Benchmarks?
With an 89.5% completion rate, more candidates finish the assessment, giving you a clearer picture of your applicant pool. You aren’t relying only on the small group of highly motivated applicants who made it to the end of a longer process. Higher completion means less sampling bias in the data driving hiring decisions.
4M+ candidates assessed across 5,000+ organizations means Xobin’s role-specific norm groups draw from a candidate database large enough to produce statistically meaningful benchmarks. Our platform compares scores against people who actually applied for similar roles in similar markets, not against a theoretical global average.
70% time-to-hire reduction: Xobin customers report this as an average, not a ceiling. The mechanism is front-end automation. Cognitive assessments trigger automatically at the shortlist stage via ATS integration, rank the candidate pool before any human review, and deliver reports to interviewers before the next scheduled conversation. No manual invitation, no follow-up email, no report that arrives after the decision has already been made informally.
50+ ATS integrations, including Greenhouse, Lever, Workday, and SAP SuccessFactors, mean the platform fits into the existing hiring stack rather than creating a parallel workflow.
Many companies using Xobin have seen a 92% improvement in quality of hire after switching to role-specific psychometric assessments. Instead of relying on traditional screening methods, they identify candidates who are a better fit for the role from the start. This improvement also strengthens the ROI discussed above. As more new hires consistently meet or exceed performance expectations, organizations naturally reduce the number of costly hiring mistakes, lowering the bad-hire costs calculated in Step 1.
Does Psychometric Testing Deliver ROI Beyond the Hiring Decision?
The ROI of psychometric testing doesn’t end at the offer letter. Xobin’s x360 suite connects pre-hire psychometric profiles to ongoing performance data, creating a continuous talent intelligence loop that generates additional ROI post-hire.
- Onboarding efficiency. A manager who knows a new hire’s Big Five profile before day one can tailor their communication style, feedback cadence, and development conversations to what that person is most likely to respond to. This shortens the onboarding curve and speeds up time to first meaningful contribution.
- Succession planning. Psychometric data from hiring becomes the baseline for identifying high-potential employees, planning internal mobility, and building leadership pipelines from within. Organizations that use assessment data for succession planning cut external senior hire costs, typically the highest-cost hires in the organization.
- L&D targeting. Skills gap analysis powered by assessment data focuses training investment on the dimensions where development will produce the highest performance return, rather than running generic programs for the whole organization.
What Does This Mean for Your Hiring Budget?
All of that, the bad hire math, the retention savings, the post-hire compounding, points to four ideas:
- A bad hire almost always costs more than an assessment does. Even at the conservative 30% of first-year salary floor, one avoided bad hire covers years of platform cost.
- Structured hiring reduces the risk that produces that cost. It doesn’t eliminate bad hires, but it replaces gut-feel screening with data that correlates with actual on-the-job outcomes.
- The return compounds rather than resets each cycle. Every bad hire avoided, every voluntary departure prevented, and every day cut from time-to-hire adds to the next hiring cycle instead of starting over.
- The only number that matters is yours, not an industry average. Run Steps 1 through 4 against your own hiring volume, salary bands, and turnover rate before deciding whether the investment makes sense.
Here’s what that looks like for one common profile: a company hiring 50 people per year at an average $60,000 salary, with a 20% bad hire rate, 25% voluntary turnover, and a conservatively assumed 15% retention improvement sees approximately $441,000 in annual benefits from better hiring outcomes. Against a platform cost of $20,000 to $40,000 annually, that’s a net saving of roughly $401,000 to $421,000 per year, and an ROI exceeding 1,000%.
That’s one company’s number. The model above shows you how to calculate yours.
Ready to see it run against your actual headcount and turnover rate? Book a personalized demo and build your custom ROI model today!
Frequently Asked Questions
How do I know if psychometric testing will pay for itself, or is that just a sales pitch?
Run the numbers on your own hiring data instead of taking a vendor’s word for it. Plug your annual hires, average salary, current bad hire rate, and turnover rate into the four-step formula above. For many organizations, avoiding just two or three poor hiring decisions is enough to recover the cost of the platform.
What’s the real cost of a bad hire in 2026, not the sales-brochure number?
A widely used conservative estimate puts the floor at 30% of first-year salary, so $18,000 for a $60,000 role. The Center for American Progress found a more granular breakdown: 16% of salary for low-wage roles, 20% for mid-range positions, and up to 213% for executive roles once you factor in productivity loss, team disruption, and the cost of rehiring for the same position.
Do personality and psychometric tests actually reduce employee turnover, or is that overstated?
The most current figure comes from TestGorilla’s 2025 State of Skills-Based Hiring Report: 62% of employers using psychometric tests and pre-employment assessments report improved retention as a result. It’s a self-reported figure, but it’s backed by peer-reviewed research showing the personality traits these tests measure are among the strongest predictors of actual turnover behavior.
How much can psychometric testing actually speed up my hiring process?
Xobin customers report an average 70% reduction in time-to-hire. The mechanism is front-end automation: cognitive assessments rank candidates before any human review starts, so recruiters spend less time on manual CV screening and early-stage interviews that would otherwise happen before a shortlist exists.
How do I build a business case for psychometric testing that my CFO will actually accept?
Use the three-variable model in this guide rather than industry averages alone: current bad hire cost, retention improvement, and time-to-hire savings, each calculated against your own headcount and salary bands. A CFO responds better to a number derived from your data than a generic “better hires” pitch.